You can find silver in
| Automotive industry Chemical catalyst Clothing Coinage Digital technology |
Ink Insulation & energy reduction Jewelry & silverware Pharmaceuticals Photography |
Reflective glass Silver oxide batteries Solar energy Water treatment X-rays |
Supply & Demand
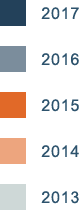
| Supply (Moz) | 2013 | 2014 | 2015 | 2016 | 2017 |
| Mine Production | 823.3 | 867.8 | 895.1 | 888.6 | 852.1 |
| Net Government Sales | 7.9 | - | - | - | - |
| Scrap | 191 | 165.4 | 141.1 | 139.7 | 138.1 |
| Net Hedging Supply | -34.8 | 16.8 | 7.8 | -18.9 | 1.4 |
| Total Supply | 987.8 | 1,050.00 | 1,044.00 | 1,009.40 | 991.6 |
| Demand (Moz) | |||||
| Jewelry | 220.6 | 226.4 | 226.7 | 205 | 209.1 |
| Coins & Bars | 241.1 | 234.1 | 292.1 | 207.8 | 151.1 |
| Silverware | 59.3 | 61.2 | 63.2 | 52.4 | 58.4 |
| (+) Industrial Fabrication | 604.6 | 596.3 | 583.2 | 576.8 | 599 |
| Physical Demand | 1,125.80 | 1,118.30 | 1,156.30 | 1,041.90 | 1017.6 |
| Physical Surplus/Deficit | -138.2 | -68 | -121.3 | -32.5 | -26 |
| ETF Inventory Build | 2.5 | 1.4 | -17.8 | 49.8 | 2.4 |
| Exchange Inventory Build | 8.8 | -5.3 | 12.6 | 79.8 | 6.8 |
| Net balance | -149.5 | -64 | -116.1 | -162.1 | -35.2 |
Silver Demand (Moz)
Physical silver demand declined 2% to 1,017.6 Moz, impacted mainly by a drop in coin and bar demand.
Jewelry fabrication returned to growth in 2017, rising 2% to 209.1 Moz.
Coins & medals fabrication declined 35% in 2017 to 79.4 Moz, the lowest since 2008.
Global silverware increased 12% in 2017 to 58.4 Moz due to a strong recovery in Indian demand.
2017 Silver Demand (Moz)

Industrial Fabrication Applications (562 Moz)
Silver is the pre-eminent electrical and thermal conductor of all metals, which makes it essential in many electrical applications.
Jewelry (207 Moz)
Pure silver does not tarnish easily but to make it durable for jewelry it is often alloyed with small amounts of copper. It is also widely used with base metals in gold alloys.
Coins and Bars (207 Moz)
Historically, silver was more widely used in coinage than gold, being in greater supply and of less value, thus being practical for everyday payments.
Silverware (52 Moz)
Sterling silver has been the standard of silverware since the 14th century, particularly in the manufacture of "hollow-ware" and "flatware".
Ounces Total Demand
Supported by
Total Mine Production
Silver Supply (Moz)
Mine Supply by Region (Moz)


Investment
As a precious metal, silver has become an investment of choice for those who recognize its traditional role as a safe haven asset.
Coins and medals – Total coin and medals fabrication amounted 123.2 Moz in 2016, the second highest level this century, with demand up year-on-year in the first half of 2016.
Silver exchange traded products (ETPs) – ETPs increased 8%, or 47.0 Moz, bringing total holdings of ETPs to 664.8 Moz. ETPs peaked in late October 2016 at 688.6, reaching an all-time high.